
What it does
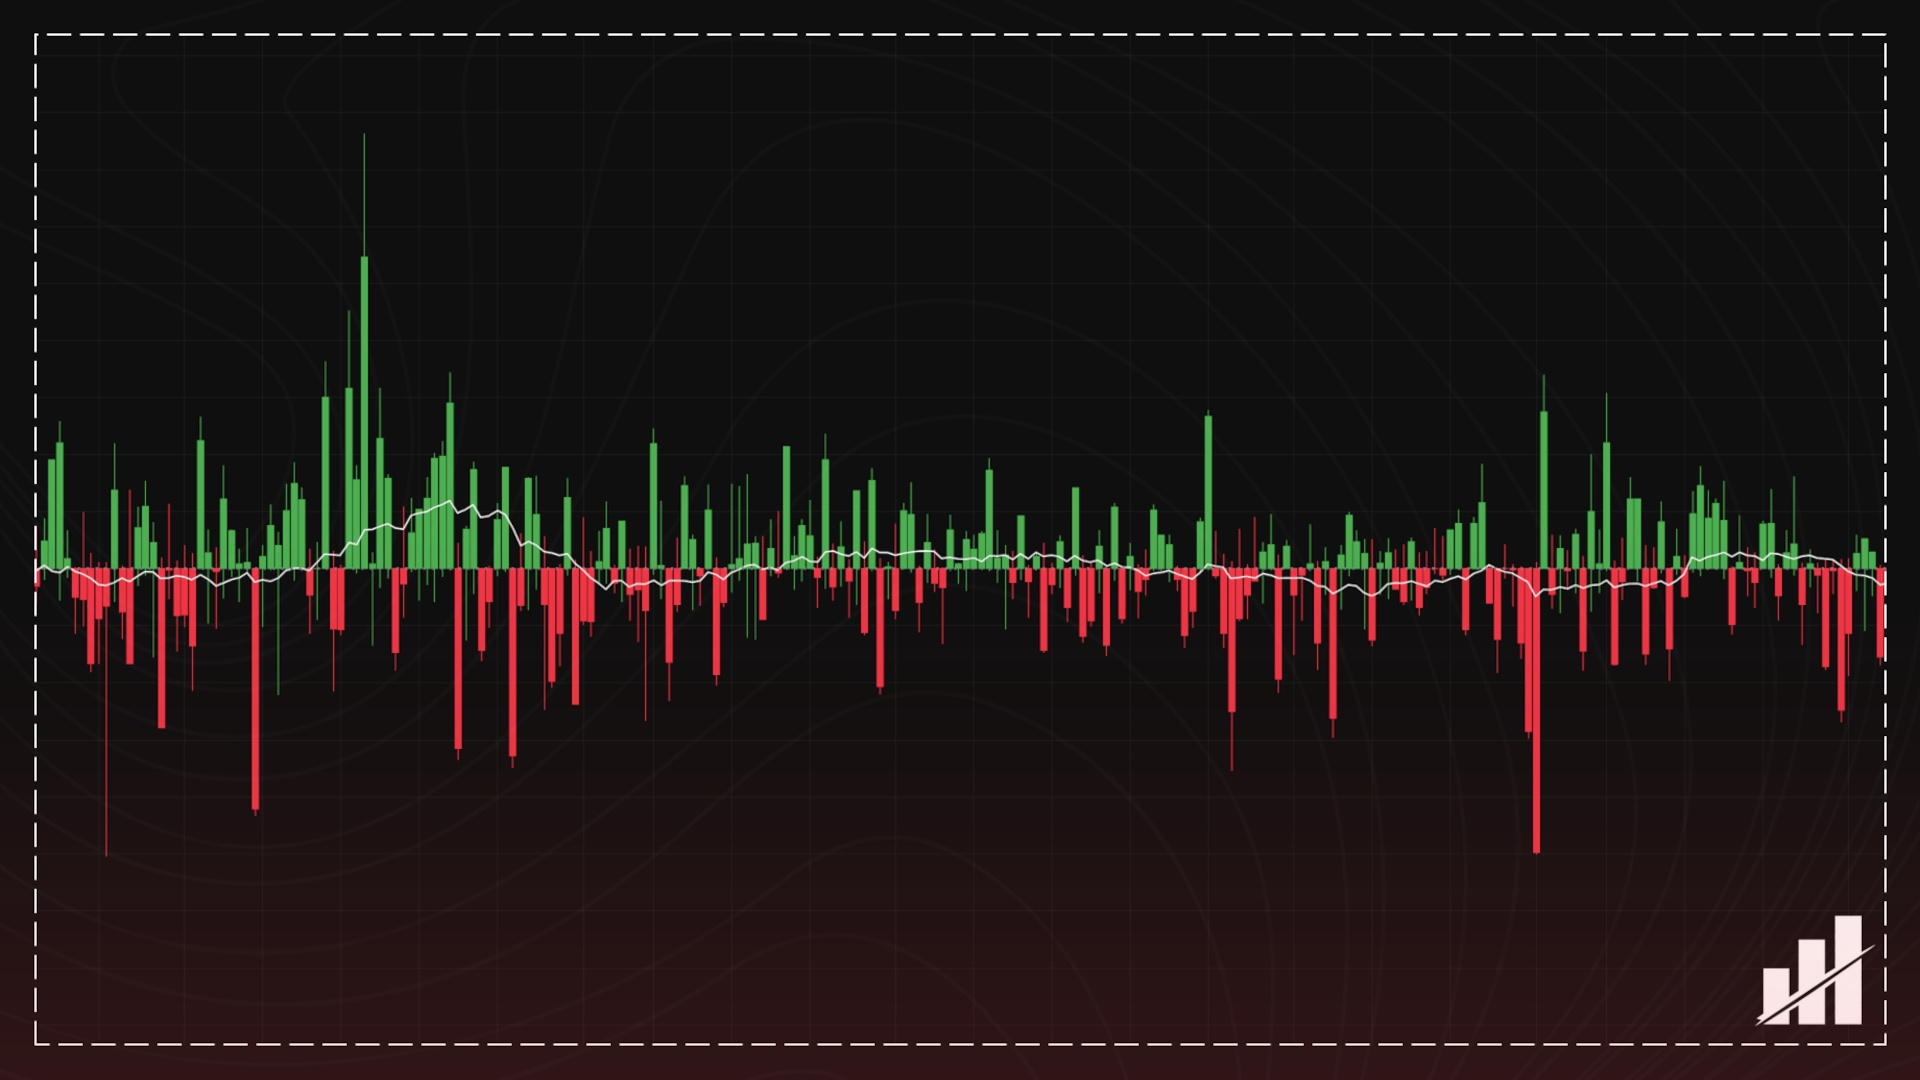
Builds cumulative delta candles by taking real lower-timeframe volume-delta shape from the chart symbol, scaling that shape to the script’s final aggregate total, and carrying the result forward with optional resets.
Calculations
1. Use ta.requestVolumeDelta() on the selected lower timeframe to get intrabar delta open, high, low, and close for the chart symbol.
2. Compute a scale factor as final aggregate total / chart bar volume when chart bar volume is valid and nonzero.
3. Multiply the intrabar delta shape by that scale factor to create the bar’s scaled delta values.
4. Apply the selected reset rule so the cumulative state either continues, resets daily, or resets on the chosen anchor period.
5. Build cumulative CVD open, high, low, and close from the running scaled delta state, then apply the overlay MA to the final CVD close.
Unique story it tells
It measures whether lower-timeframe buying or selling imbalance is accumulating through time, while the size of each move is scaled by the script’s final aggregate total rather than by the chart symbol’s standalone volume alone.
How it identifies tops/bottoms
It does not include built-in top/bottom markers, thresholds, or reversal labels. Tops and bottoms are usually read through divergence and confirmation: a likely top can form when price keeps rising but CVD stops confirming, while a likely bottom can form when price keeps falling but CVD stops confirming.
Story it tells when indicator is rising
Rising means cumulative buy-side pressure is winning over sell-side pressure, so positive delta is building through time.
Story it tells when indicator is falling
Falling means cumulative sell-side pressure is dominating, so negative delta is building through time.
Story it tells when indicator is neutral
Neutral usually means cumulative delta is not making meaningful progress because buy and sell pressure are staying balanced. In this script, neutral can also appear right after a reset because the running CVD state has been restarted.
What it means when indicator is rising + price is rising
Bullish confirmation: price is advancing and cumulative delta is also improving, which shows buyers are supporting the move.
What it means when indicator is rising + price is falling
Possible absorption or bullish divergence: price is weakening, but cumulative delta is improving underneath the surface.
What it means when indicator is falling + price is rising
Possible bearish divergence: price is rising while cumulative delta is deteriorating, which can suggest selling into strength.
What it means when indicator is falling + price is falling
Bearish confirmation: price is declining and cumulative delta is also worsening, so sellers are reinforcing the move.
Unique features and settings
Adjustable settings
Market Type — limits the scaling total to Spot, Perps, or Both.
Mode — builds the scaling total in Base Units or USD Turnover before CVD is scaled.
CVD Reset Mode — chooses whether CVD runs continuously, resets each day, or resets on a selected anchor timeframe.
Anchor Period — sets the reset timeframe used when Reset by Anchor TF is selected.
Use Custom Intrabar Timeframe — lets you override the automatic lower timeframe used for delta construction.
Intrabar Timeframe — sets the custom lower timeframe used for requestVolumeDelta() when custom intrabar mode is enabled.
MA Type — selects the overlay moving average type for the final CVD Close line.
MA Length — sets the overlay moving average length.
Show Debug Table — displays the full per-venue audit table for the active routed asset.
Font Size — changes the debug table text size.
Location — moves the debug table on the chart.
Hardcoded settings
Final launch venue map — uses the suite’s finalized routed spot and perpetual venue lists as the aggregate source.
Spot/perp interpretation metadata — defines whether each venue contributes as Base, Quote, or Contracts.
Contract mode metadata — defines how contract-based rows convert before they enter the aggregate.
Contract Sizes — apply stored multipliers to perpetual rows that use contract counts.
Data-defense behavior — keeps venue-ignore protection enabled when repeated bad data appears.
Bad-bar threshold — removes a venue’s used contribution after 5 consecutive bad bars.
BASE_ONLY enforcement — forces Base Units internally on supported non-USD or index-like charts.
FALLBACK behavior — switches to the chart’s own volume on unsupported-base charts.
Market-type total-selection — uses explicit Spot / Perps / Both logic to choose the active total.
Debug fetch behavior — may widen active routed fetch scope to show the full venue map, while still reusing each venue fetch once and keeping Used and % Share honest.
Approved intrabar source exception — uses TradingView’s official ta.requestVolumeDelta() path on the chart symbol to build intrabar delta shape.
Shape-and-scale rule — keeps chart-symbol intrabar delta shape and routed aggregate magnitude as separate layers, then scales the delta shape with the aggregate total.
Auto intrabar timeframe mapping — uses 1S on charts up to 1 minute, 5S up to 5 minutes, 15S up to 15 minutes, 1 minute up to 4 hours, 5 minutes up to 1 day, and 60 minutes above 1 day.
Invalid custom intrabar fallback — reverts to the automatic lower timeframe when the chosen custom timeframe is not actually lower than the chart timeframe.
First-valid-bar policy — does not plot or accumulate before real intrabar delta data, valid chart-symbol volume, and a valid aggregate or fallback scale source are available.
Synthetic history policy — does not backfill unavailable earlier CVD history with synthetic bar-polarity estimates.
Invalid-bar accumulation rule — does not advance CVD state when intrabar delta data, chart-symbol volume, or the aggregate/fallback scale source is invalid.
Reset timing rule — daily resets use chart-day changes, and anchor resets use time(anchor_tf) changes on the chart.
MA attachment rule — applies the moving average to the final CVD Close line only.
Notes specific to this script
This is the suite’s approved exception that uses TradingView’s official ta.requestVolumeDelta() import for intrabar delta shape; that behavior is specific to this script and is not the suite-wide model for the other indicators.
The script begins plotting only when real intrabar delta data, valid chart-symbol volume, and a valid aggregate or fallback scale source exist, so early history is intentionally left unavailable instead of being synthetically reconstructed.
The running CVD state does not advance when the intrabar delta data, chart-symbol volume, or aggregate/fallback scale source is invalid, which keeps cumulative history from drifting before the true source is ready.
This script plots cumulative candles, not just a single line, because it builds cumulative open, high, low, and close values for each bar from the scaled intrabar delta shape.
If the chosen custom intrabar timeframe is not lower than the chart timeframe, the script automatically falls back to its auto-LTF mapping.
Mode changes the size of the CVD move, but the directional shape still comes from the chart symbol’s lower-timeframe delta path.