
What it does
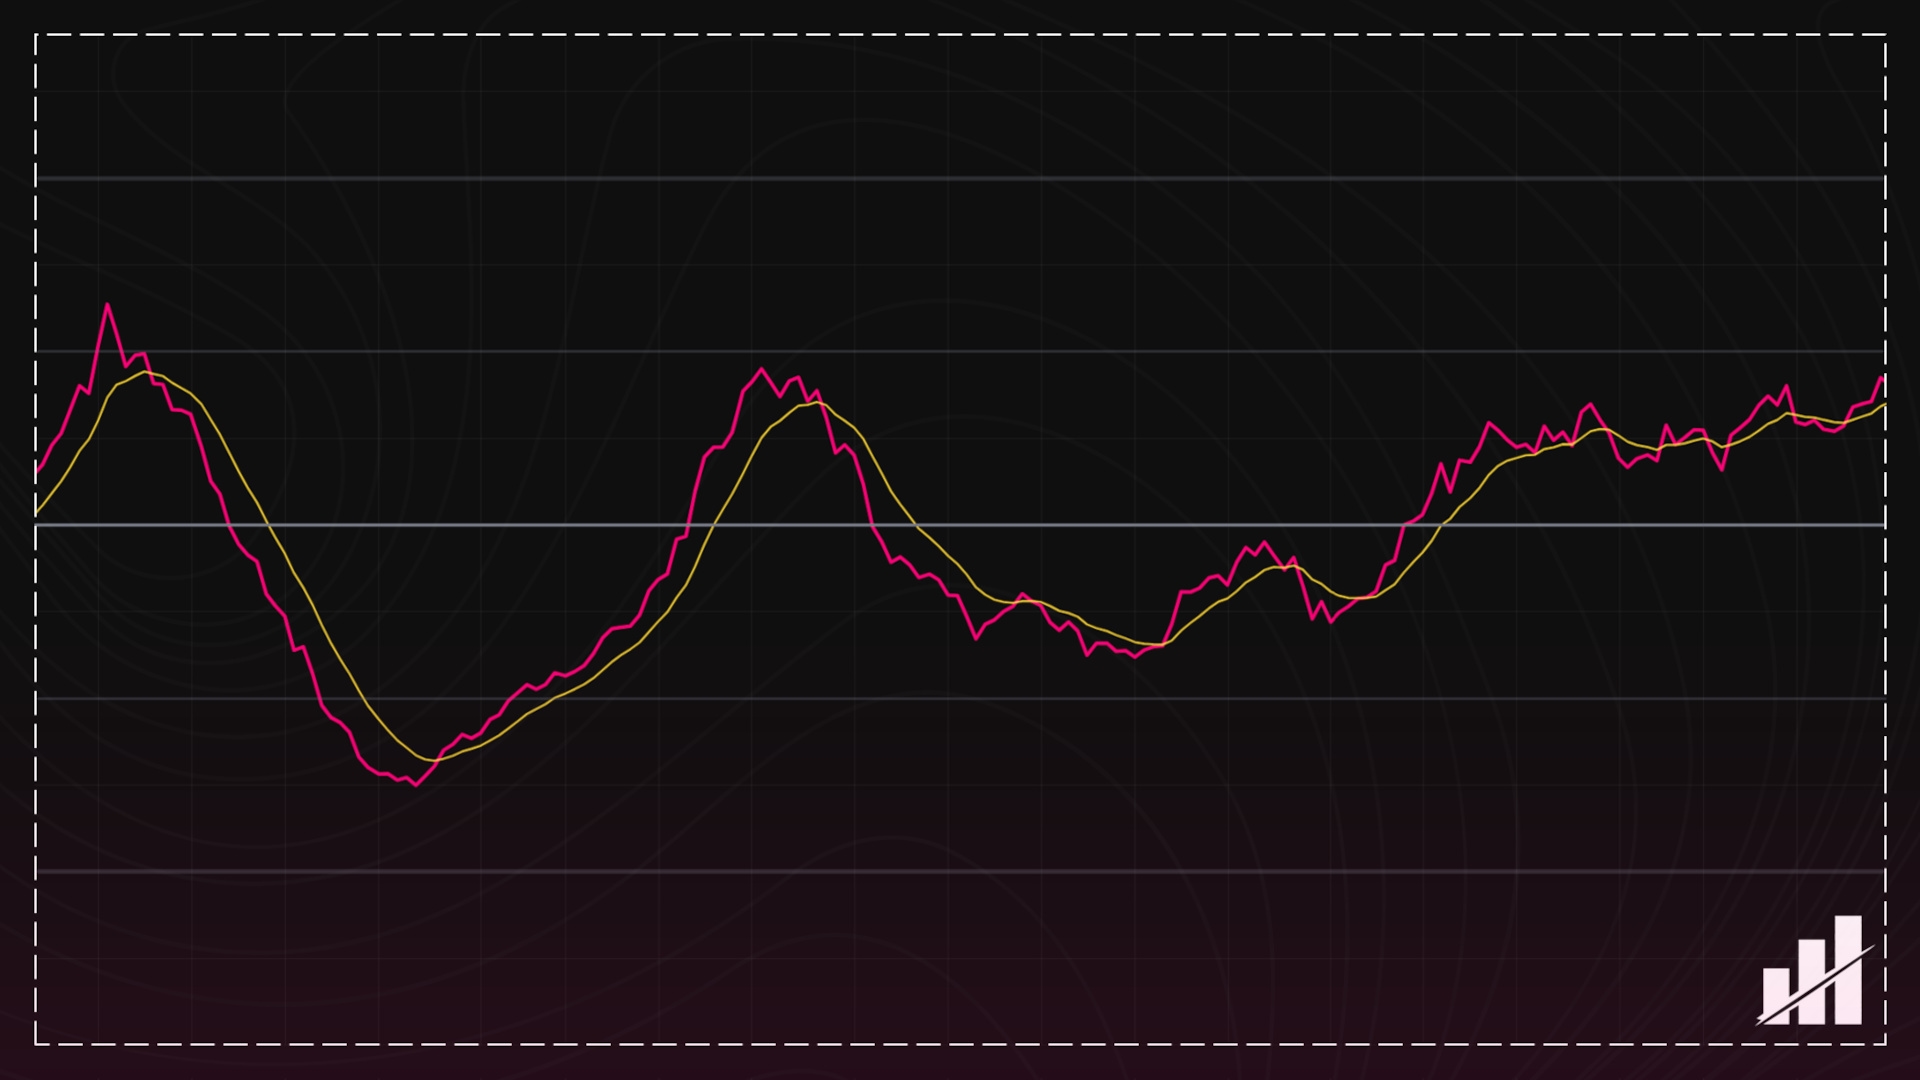
Compares scaled aggregate effort to the chart bar’s high-low range, then displays that relationship either as Raw EVR or as a normalized Z-Scored EVR line.
Calculations
1. Compute the protected chart range as max(High – Low, mintick floor).
2. Scale the final aggregate total by dividing it by the Divisor.
3. Build Raw EVR as scaled total / protected chart range.
4. If EVR Type = Raw EVR, display Raw EVR and apply the overlay MA to that line.
5. If EVR Type = Z-Scored EVR, normalize Raw EVR with a rolling z-score, optionally smooth that z-score, and then apply the signal EMA.
Unique story it tells
It measures how much aggregate effort is required to produce each unit of chart range, which makes it useful for spotting movement that is becoming effort-heavy and absorption-like versus movement that is progressing more easily.
How it identifies tops/bottoms
It does not include built-in top/bottom markers or reversal labels. The clearest reversal context comes from Z-Scored EVR, where unusually high readings versus recent history can highlight effort-heavy conditions worth watching for exhaustion or absorption, but the script still requires price context to decide whether a top or bottom is forming.
Story it tells when indicator is rising
Rising means effort per unit of range is increasing, so price is requiring more aggregate participation to produce the same amount of movement. That usually points to growing friction, absorption, or reduced efficiency.
Story it tells when indicator is falling
Falling means effort per unit of range is decreasing, so price is achieving movement more easily relative to the final aggregate total. That usually points to cleaner, more efficient expansion.
Story it tells when indicator is neutral
Neutral usually means effort relative to result is staying near its recent baseline, with no major shift toward unusually heavy absorption or unusually easy movement. In Z-Scored mode, this is typically seen when the line stays near zero.
What it means when indicator is rising + price is rising
Price is still advancing, but it is requiring more effort per unit of range. That can mean the upside is becoming less efficient and may be running into friction or absorption.
What it means when indicator is rising + price is falling
Price is declining, but the move is requiring more effort per unit of range. That can mean the downside is becoming less efficient and may be meeting absorption or support.
What it means when indicator is falling + price is rising
Bullish efficiency. Price is advancing with less effort per unit of range. That usually points to cleaner, more efficient upside movement.
What it means when indicator is falling + price is falling
Bearish efficiency. Price is declining with less effort per unit of range. That usually points to cleaner, more efficient downside movement.
Unique features and settings
Adjustable settings
Market Type — limits the calculation to Spot, Perps, or Both.
Mode — builds the input using Base Units or USD Turnover before the EVR math is applied.
EVR Type — switches the display between Z-Scored EVR and Raw EVR.
Divisor — scales the final aggregate total before it is divided by chart range; larger values may be needed when using USD Turnover.
Z-Score Lookback — sets the lookback used to calculate the rolling mean and standard deviation for the z-score.
Z-Score Smoothing Type — selects the optional smoothing applied to the z-score line itself, not to Raw EVR.
Z-Score Smoothing Length — sets the length for the selected z-score smoothing type; ignored when smoothing is set to None.
Z-Score Signal EMA Length — sets the EMA length used for the z-score signal line.
Raw EVR MA Type — selects the display overlay moving average type for Raw EVR only.
Raw EVR MA Length — sets the display overlay moving average length for Raw EVR only.
Show Debug Table — displays the full per-venue audit table for the active routed asset.
Font Size — changes the debug table text size.
Location — moves the debug table on the chart.
Hardcoded settings
Final launch venue map — uses the suite’s finalized routed spot and perpetual venue lists as the aggregate source.
Spot/perp interpretation metadata — defines whether each venue contributes as Base, Quote, or Contracts.
Contract mode metadata — defines how contract-based rows convert before they enter the aggregate.
Contract Sizes — apply stored multipliers to perpetual rows that use contract counts.
Data-defense behavior — keeps venue-ignore protection enabled when repeated bad data appears.
Bad-bar threshold — removes a venue’s used contribution after 5 consecutive bad bars.
BASE_ONLY enforcement — forces Base Units internally on supported non-USD or index-like charts.
FALLBACK behavior — switches to the chart’s own volume on unsupported-base charts.
Market-type total-selection — uses explicit Spot / Perps / Both logic to choose the active total.
Debug fetch behavior — may widen active routed fetch scope to show the full venue map, while still reusing each venue fetch once and keeping Used and % Share honest.
Range source — always uses the chart bar’s high-low range inside the EVR formula.
Zero-range protection — uses a mintick floor in the range denominator so flat bars do not break the formula.
Scaling rule — always divides the final aggregate total by the Divisor before it enters the EVR formula.
Raw EVR construction — always builds Raw EVR as scaled effort divided by protected chart range.
Raw EVR overlay rule — applies the shared moving-average overlay to the displayed Raw EVR line only.
Z-score source — always normalizes the raw EVR line, not the smoothed Raw EVR display line.
Z-score validity rule — only outputs z-score values when mean and standard deviation are valid and the standard deviation is nonzero.
Z-score signal type — always builds the signal line as an EMA of the z-score line.
Display mode rule — plots either Z-Scored EVR or Raw EVR, not both at once.
Z-score reference levels — always shows 0, ±1σ, and ±2σ reference levels in z-score mode.
Notes specific to this script
This script is not directional by formula. Raw EVR only compares scaled effort to chart range, so direction must be interpreted from price, not from the EVR formula itself. The shared Moving Average section only affects Raw EVR, while the z-score smoothing and z-score signal belong to the indicator-specific section. Z-Scored EVR is built from Raw EVR itself, not from the smoothed Raw EVR display line. There is no reset behavior or cumulative state in this script. Raw EVR remains unavailable when the required effort, range, or aggregate-total inputs cannot produce a valid ratio, while z-score values remain unavailable until the mean and standard deviation are valid and the standard deviation is nonzero.