
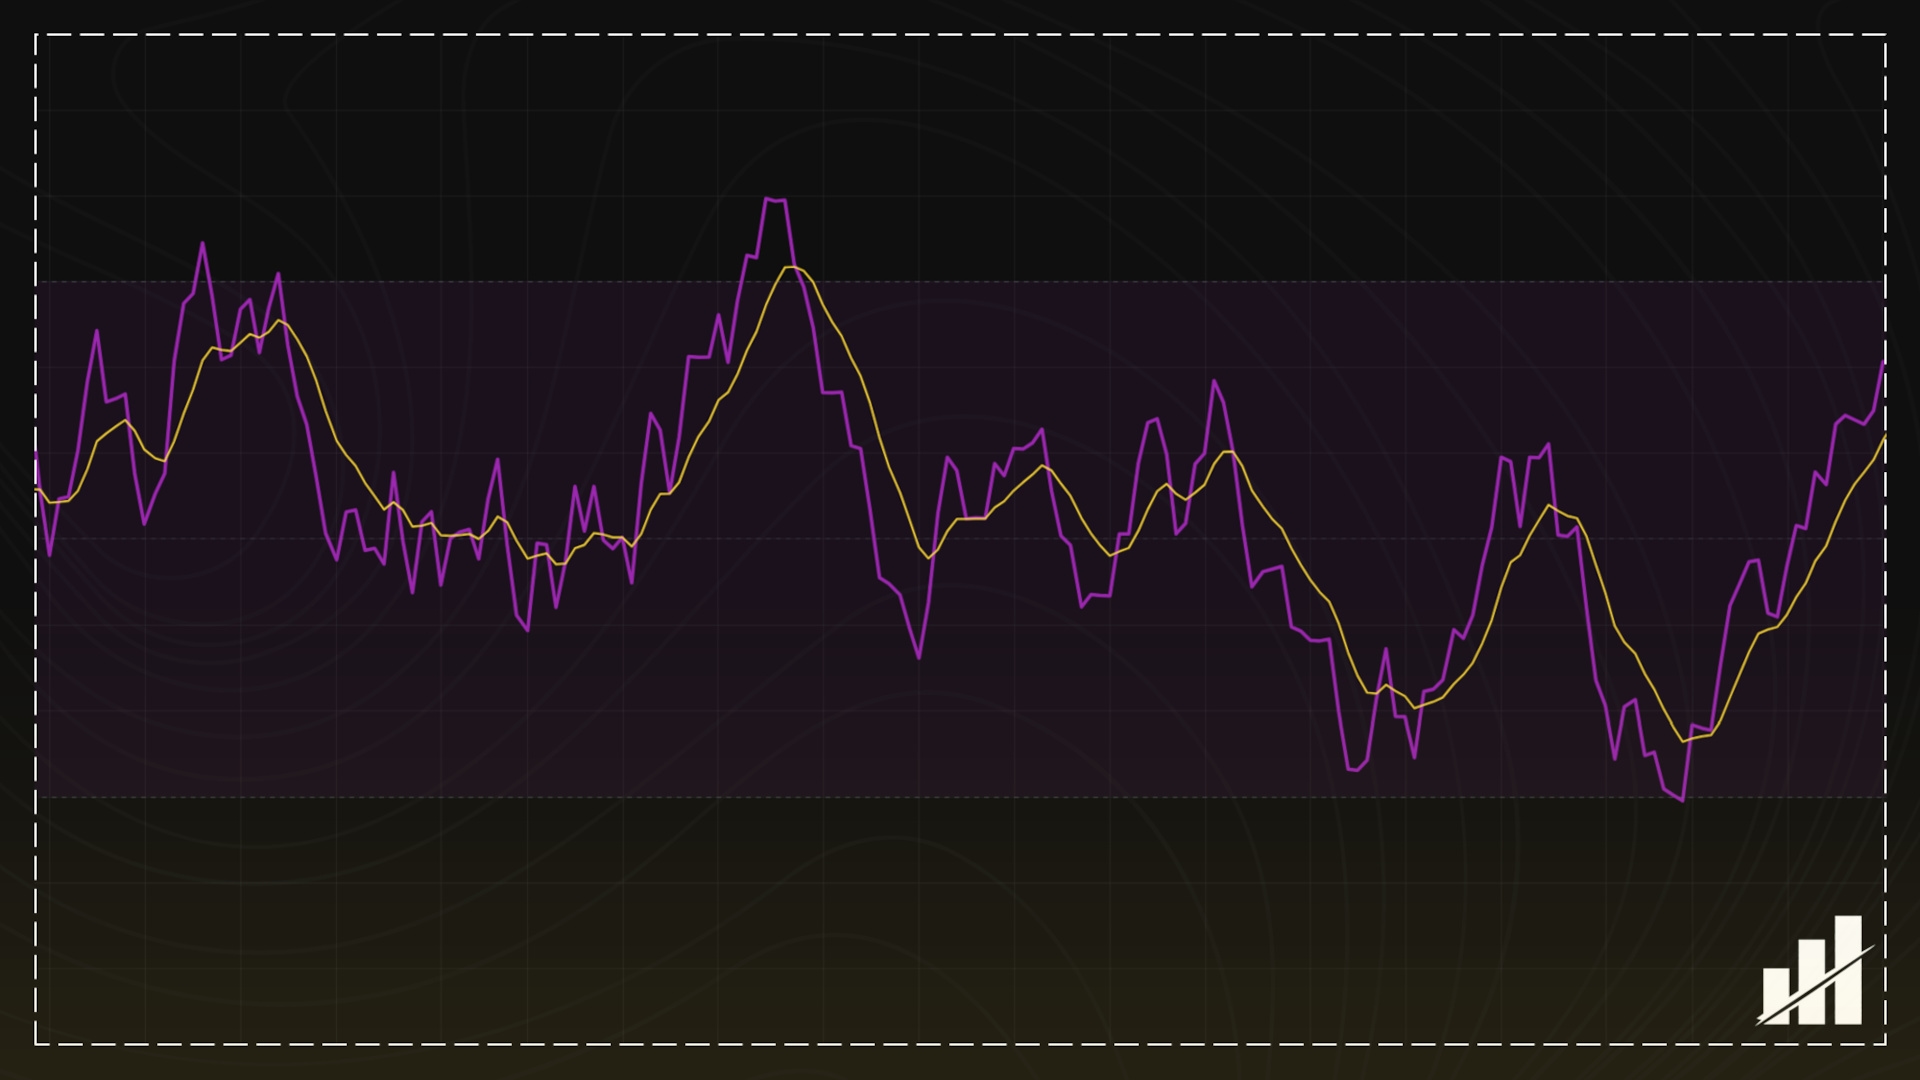
What it does
Converts aggregate money flow into a bounded 0–100 oscillator by comparing rolling positive and negative money flow built from chart Typical Price direction and the final aggregate total.
Calculations
1) Set Typical Price to HLC3 and determine whether it rose or fell versus the prior bar.
2) Build raw money flow as Typical Price × total in Base Units mode, or as total directly in USD Turnover mode.
3) Send that money flow into the positive or negative bucket depending on whether Typical Price rose or fell, then sum those buckets over the selected MFI Length.
4) Convert the positive/negative flow ratio into a 0–100 MFI value, handle the zero-flow edge cases, and apply an EMA to the finished MFI line for the signal.
Unique story it tells
It measures whether positive money flow or negative money flow is dominating over the lookback by comparing aggregate flow on rising Typical Price bars against aggregate flow on falling Typical Price bars.
How it identifies tops/bottoms
It uses fixed overbought and oversold reference zones at 80 and 20. Likely tops are usually watched when the line reaches the upper zone and starts weakening, while likely bottoms are usually watched when the line reaches the lower zone and starts turning up; divergence can strengthen that read.
Story it tells when indicator is rising
Rising means positive money flow is gaining relative to negative money flow, so buying pressure is improving across the lookback.
Story it tells when indicator is falling
Falling means negative money flow is gaining relative to positive money flow, so selling pressure is strengthening across the lookback.
Story it tells when indicator is neutral
Neutral usually means money flow is relatively balanced, often seen when the line hovers around the 50 area or flattens after recent swings. In the script’s strict edge case, it resolves exactly to 50 when both positive and negative money-flow sums are zero.
What it means when indicator is rising + price is rising
Bullish confirmation: price is advancing and positive money flow is also strengthening.
What it means when indicator is rising + price is falling
Possible bullish divergence or hidden accumulation: price is weakening, but positive money flow is improving underneath the surface.
What it means when indicator is falling + price is rising
Possible bearish divergence: price is advancing while money flow is weakening, which can suggest fading internal support.
What it means when indicator is falling + price is falling
Bearish confirmation: price is declining and negative money flow is also strengthening.
Unique features and settings
Adjustable settings
Market Type — limits the calculation to Spot, Perps, or Both.
Mode — builds the money-flow input using Base Units or USD Turnover before the MFI math is applied.
MFI Length — sets the rolling lookback used for positive and negative money-flow sums.
Signal EMA Length — sets the EMA length used for the MFI signal line.
Show Debug Table — displays the full per-venue audit table for the active routed asset.
Font Size — changes the debug table text size.
Location — moves the debug table on the chart.
Hardcoded settings
Final launch venue map — uses the suite’s finalized routed spot and perpetual venue lists as the aggregate source.
Spot/perp interpretation metadata — defines whether each venue contributes as Base, Quote, or Contracts.
Contract mode metadata — defines how contract-based rows convert before they enter the aggregate.
Contract Sizes — apply stored multipliers to perpetual rows that use contract counts.
Data-defense behavior — keeps venue-ignore protection enabled when repeated bad data appears.
Bad-bar threshold — removes a venue’s used contribution after 5 consecutive bad bars.
BASE_ONLY enforcement — forces Base Units internally on supported non-USD or index-like charts.
FALLBACK behavior — switches to the chart’s own volume on unsupported-base charts.
Market-type total-selection — uses explicit Spot / Perps / Both logic to choose the active total.
Debug fetch behavior — may widen active routed fetch scope to show the full venue map, while still reusing each venue fetch once and keeping Used and % Share honest.
Typical Price source — always uses chart HLC3 as Typical Price.
Directional flow rule — classifies money flow by comparing the current Typical Price to the prior Typical Price.
Mode-dependent money-flow construction — uses Typical Price × total in Base Units mode and total directly in USD Turnover mode.
Rolling-sum construction — uses rolling positive and negative money-flow sums over the selected MFI Length.
Warmup gate — only outputs MFI after a full valid lookback of Typical Price direction and active routed or fallback total data is available.
Neutral-resolution rule — returns 50 when both positive and negative money-flow sums are zero.
One-sided resolution — returns 100 when negative flow is zero and 0 when positive flow is zero.
Signal type — always builds the signal line as an EMA of the final MFI line.
Reference levels — always shows 80, 50, and 20 levels.
Band fill — always shades the 20–80 zone.
Notes specific to this script
This script does not use a shared Moving Average section; the only secondary line is the indicator-specific Signal EMA. It classifies money flow using Typical Price direction, not close-to-close direction. In Base Units mode, it multiplies Typical Price by the final aggregate total, while in USD Turnover mode it uses the final aggregate total directly. The final MFI does not plot until a full valid lookback is available, which is stricter than simply starting immediately from partial rolling history. The 20–80 band is a visual reference zone, while the signal line is the only plotted smoothing layer.