
What it does
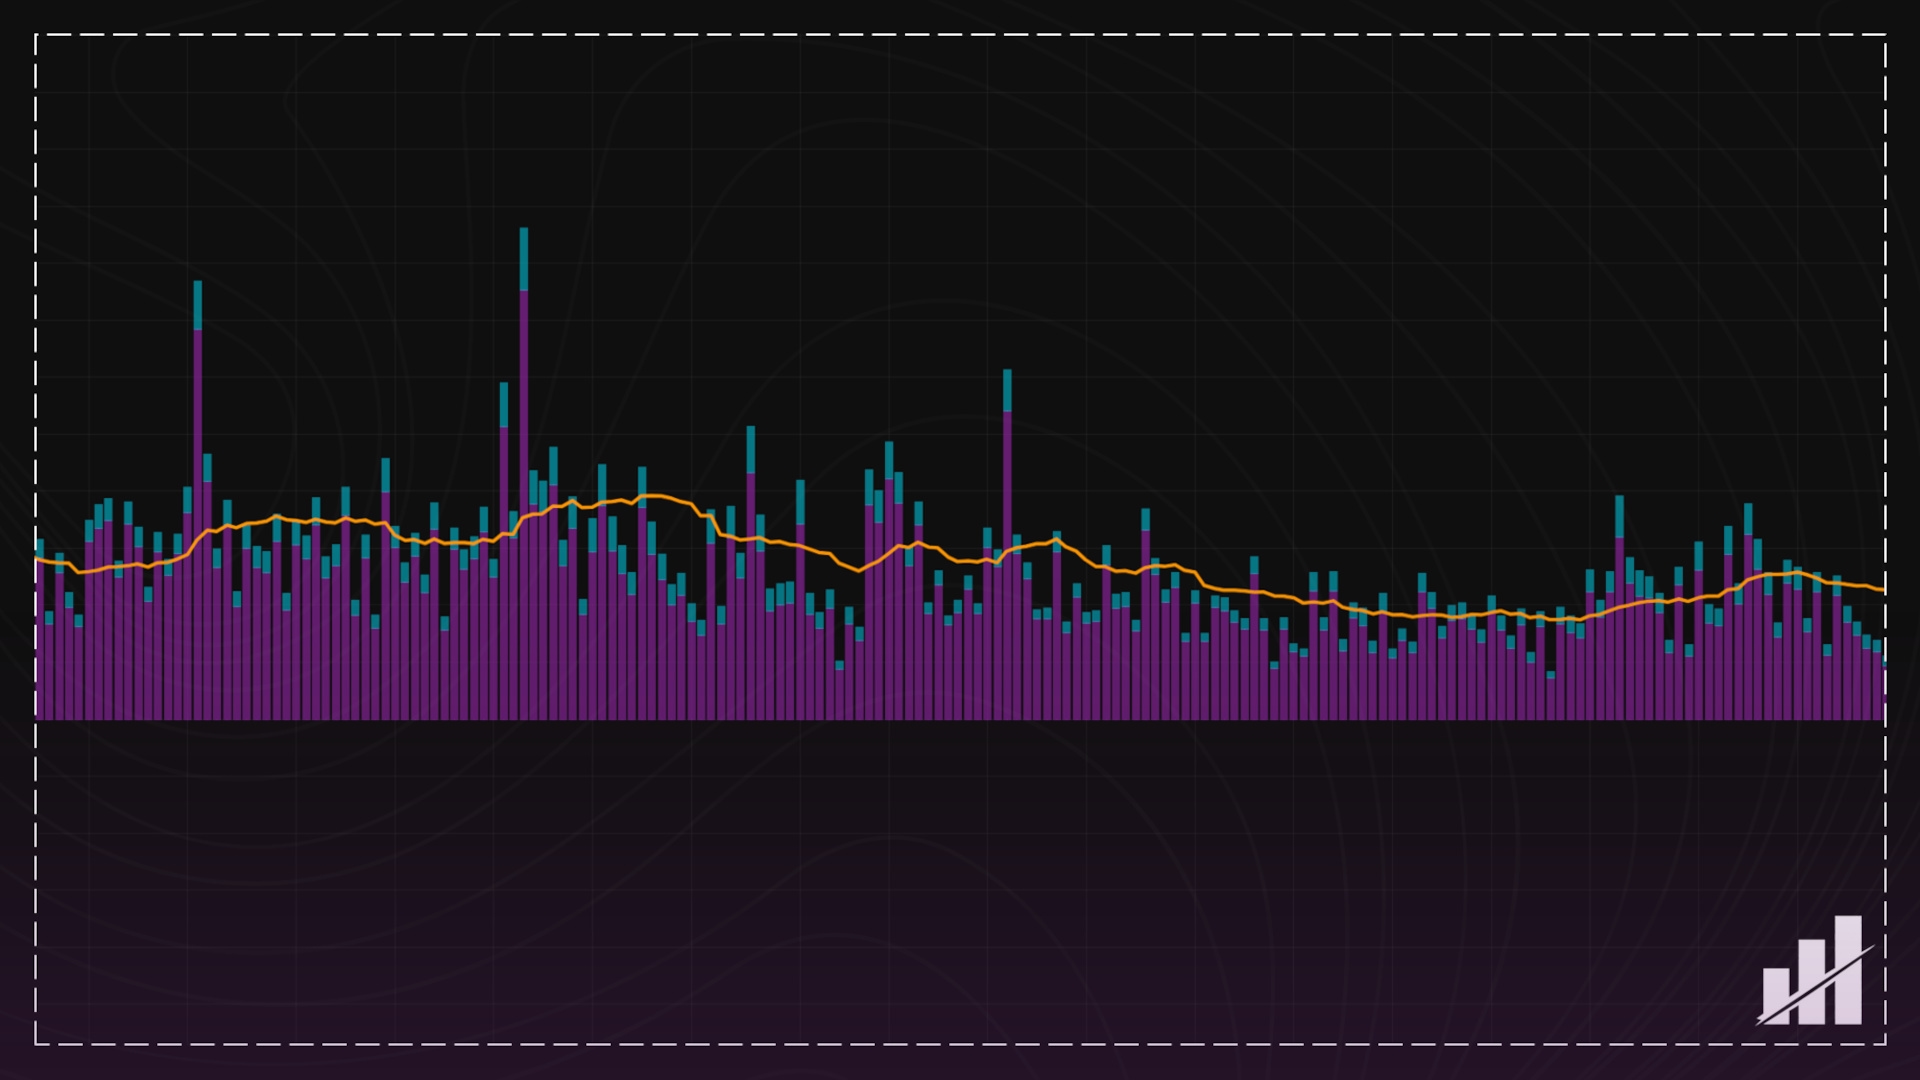
Displays the active total as either one histogram or a stacked spot-plus-perps histogram, with a moving average plotted over the same final total.
Calculations
1) Use the active plotted total selected by Market Type as the source series, with fallback using the chart’s own volume path when required.
2) Calculate the moving average from that final total using the selected MA Type and MA Length.
3) If stacked mode is active, plot Perps from 0 to perp_total and Spot from perp_total to total.
4) Otherwise, plot one histogram of the active total and color it from chart candle direction using close > open for green and red otherwise.
Unique story it tells
It measures how much total participation is entering the market, and in stacked mode it also shows how that participation is split between spot and perpetuals.
How it identifies tops/bottoms
It does not include built-in top/bottom markers, thresholds, or reversal labels. Possible tops and bottoms are usually read contextually through volume expansion, contraction, and climactic spikes relative to price, not from a fixed rule inside the script.
Story it tells when indicator is rising
Rising means participation is increasing, so more total activity is entering the market.
Story it tells when indicator is falling
Falling means participation is decreasing, so less total activity is entering the market.
Story it tells when indicator is neutral
Neutral usually means participation is steady, with no major expansion or contraction in total activity.
What it means when indicator is rising + price is rising
Price is advancing with increasing participation, which usually means the move is attracting broader activity.
What it means when indicator is rising + price is falling
Price is declining with increasing participation, which usually means the move lower is happening with stronger market involvement.
What it means when indicator is falling + price is rising
Price is advancing on lighter participation, which can mean the move is progressing with less broad involvement.
What it means when indicator is falling + price is falling
Price is declining on lighter participation, which can mean the move lower is happening with less broad involvement.
Unique features and settings
Adjustable settings
Market Type — limits the calculation to Spot, Perps, or Both.
Mode — builds the input using Base Units or USD Turnover before the Total Volume plots are drawn.
Histogram Mode — switches between a stacked Spot + Perps histogram and one Total Histogram of the active total.
MA Type — selects the overlay moving average type for the total line.
MA Length — sets the overlay moving average length.
Show Debug Table — displays the full per-venue audit table for the active routed asset.
Font Size — changes the debug table text size.
Location — moves the debug table on the chart.
Hardcoded settings
Final launch venue map — uses the suite’s finalized routed spot and perpetual venue lists as the aggregate source.
Spot/perp interpretation metadata — defines whether each venue contributes as Base, Quote, or Contracts.
Contract mode metadata — defines how contract-based rows convert before they enter the aggregate.
Contract Sizes — apply stored multipliers to perpetual rows that use contract counts.
Data-defense behavior — keeps venue-ignore protection enabled when repeated bad data appears.
Bad-bar threshold — removes a venue’s used contribution after 5 consecutive bad bars.
BASE_ONLY enforcement — forces Base Units internally on supported non-USD or index-like charts.
FALLBACK behavior — switches to the chart’s own volume on unsupported-base charts.
Market-type total-selection — uses explicit Spot / Perps / Both logic to choose the active total.
Debug fetch behavior — may widen active routed fetch scope to show the full venue map, while still reusing each venue fetch once and keeping Used and % Share honest.
Histogram-mode availability rule — stacked mode is available only when Market Type = Both and the chart is not in FALLBACK.
Total histogram construction — plots one histogram of the active total when stacked mode is not active.
Stacked histogram construction — plots Perps as the lower stack from 0 to perp_total and Spot as the upper stack from perp_total to total.
Histogram color rule — colors the Total Histogram by chart candle direction, using green when close > open and red otherwise.
MA attachment rule — applies the moving average to the final total line only.
Notes specific to this script
This script is not directional by formula, because it measures amount of participation rather than buying-versus-selling pressure. In stacked mode, the moving average still tracks the final total, not the individual stack components. Unsupported-base charts always use Total Histogram, even if stacked mode is selected. The Total Histogram color is driven by chart candle direction, not by whether total volume itself rose or fell versus the prior bar. There is no signal line, no threshold structure, and no bounded oscillator range in this script.