
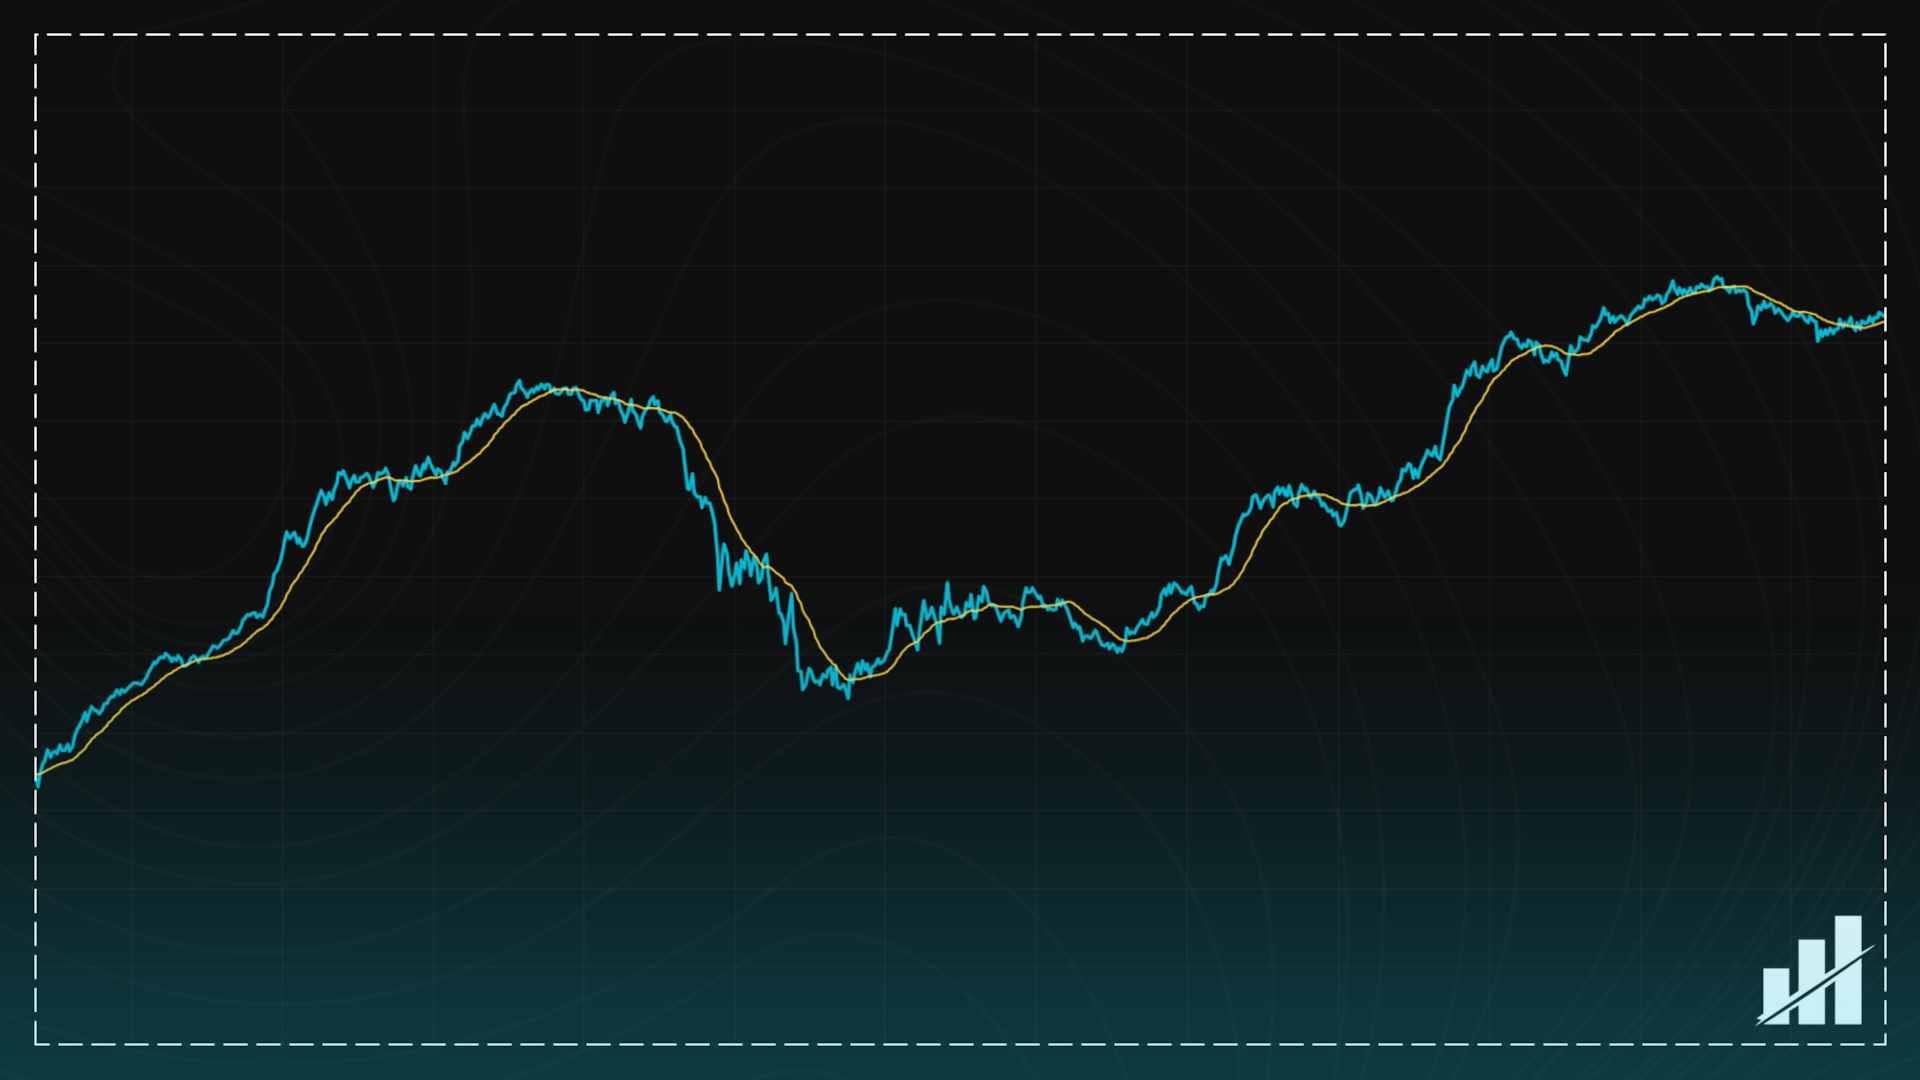
Price can move quickly, but price alone does not always show the quality of participation behind the move. A breakout may look strong on the chart, but if volume is mostly tied to weak candle closes, the move may have less support than price suggests. At the same time, price may remain inside a range while volume behavior quietly starts to lean in one direction.
The Accumulation Distribution Line, or ADL, helps traders study that relationship. Traders use ADL to evaluate trend participation, pullbacks, breakouts, failed breakouts, pressure inside trading ranges, and divergence between price and volume-weighted behavior.
In this guide, we’ll cover everything you need to know about the ADL indicator, including what it is, the math behind how it works, and strategies to put it to good use in your trading.
What Is ADL?
The Accumulation Distribution Line is a cumulative price-volume indicator developed by market analyst Marc Chaikin. It was originally known as the Cumulative Money Flow Line and later became closely associated with related tools such as Chaikin Money Flow and the Chaikin Oscillator.
At its core, ADL asks one practical question:
Where did the candle close within its full high-low range, and how much volume was attached to that candle?
A close near the high adds positive volume-weighted pressure to the line. A close near the low subtracts from it. A close near the midpoint contributes little or nothing. Over time, those values build into a running total.
What ADL Shows — and What It Does Not
The words “accumulation” and “distribution” should not be interpreted too literally.
A rising ADL does not prove that institutions, whales, or long-term investors are accumulating an asset. It means more volume is being associated with candles closing in the upper parts of their ranges.
On the flip side, a falling ADL does not prove that informed sellers are distributing, either. It means more volume is being associated with candles closing in the lower parts of their ranges.
ADL is best understood as a pressure proxy. It uses candle location and volume to estimate whether trading activity is occurring near the stronger or weaker part of each candle. That makes it useful for confirmation, context, and disagreement analysis, but not as a standalone prediction tool.
How ADL Is Calculated
The standard ADL calculation has three parts:
- Money Flow Multiplier.
- Money Flow Volume.
- Cumulative ADL.
1. Money Flow Multiplier
The Money Flow Multiplier measures where the candle closed within its high-low range.
Money Flow Multiplier =
((Close – Low) – (High – Close)) / (High – Low)
The same formula can also be written as:
Money Flow Multiplier =
(2 × Close – High – Low) / (High – Low)
It can also be understood as a normalized close location, where a close at the low equals -1, a close at the midpoint equals 0, and a close at the high equals +1.
| Close location | Multiplier | Meaning |
| Close at the high | +1 | Strongest positive contribution |
| Close above midpoint | Between 0 and +1 | Partial positive contribution |
| Close at midpoint | 0 | No contribution |
| Close below midpoint | Between 0 and -1 | Partial negative contribution |
| Close at the low | -1 | Strongest negative contribution |
This is why ADL can behave differently from what a trader might expect by only looking at green or red candles.
A bullish candle can reduce ADL if it closes near the bottom of its full range. A bearish candle can raise ADL if it closes near the top of its range. ADL does not care where the candle opened. It only cares where the candle closed relative to its high and low.
2. Money Flow Volume
Once the multiplier is calculated, it is multiplied by volume.
Money Flow Volume =
Money Flow Multiplier × Volume
This step gives high-volume candles more influence than low-volume candles.
3. Cumulative ADL
The final step adds Money Flow Volume to the prior ADL value.
ADL =
Previous ADL + Current Money Flow Volume
Because ADL is cumulative, each new candle builds on everything that came before it. The cumulative value becomes useful when compared against price structure.
ADL Settings, Timeframes, and TradingView Setup
The standard ADL calculation has no lookback period.
There is no conventional 14-period, 20-period, or 50-period ADL setting because the indicator is cumulative. Unlike RSI, stochastic, moving averages, or Chaikin Money Flow, the standard ADL does not ask the user to choose a window length.
The main choices are:
- Timeframe.
- Instrument.
- Exchange or data source.
- Whether to apply optional smoothing.
Some custom ADL indicators add a moving average to the completed line. This can make the broader direction easier to see or help traders create custom crossover alerts. The moving average is not part of the standard ADL formula, so any smoothing rule should be tested before being treated as meaningful.
In TradingView, open the Indicators menu, search for Accumulation/Distribution, and add the built-in version in a lower panel beneath price.
TradingView also allows alerts on indicators, data series, strategies, and drawing objects. For ADL, alerts are usually more useful when based on recent structure, such as a break of a marked ADL swing high or swing low, rather than arbitrary numerical values.
How to Read ADL
ADL should be read structurally.
The raw number does not have standardized meaning. A reading of 10 million is not automatically bullish. A negative value is not automatically bearish. A move above or below zero does not carry the same meaning it might have on a zero-centered oscillator.
The displayed value depends on volume units, available chart history, exchange or data source, and timeframe. For that reason, ADL is usually more useful when interpreted through direction, slope, swing highs and lows, breaks of recent structure, and agreement or disagreement with price.
| ADL behavior | Practical read |
| Rising ADL | Positive Money Flow Volume is accumulating; strongest when price is also trending higher |
| Falling ADL | Negative Money Flow Volume is accumulating; strongest when price is also trending lower |
| Flat or choppy ADL | Pressure is mixed, balanced, or range-bound; wait for structure to become clearer |
| Sharp ADL move | Inspect the candle and volume source before treating the move as meaningful |
Price and ADL Confirmation
A practical way to start reading ADL is to compare price direction with ADL direction over the same group of candles.
| Price behavior | ADL behavior | Practical interpretation |
| Price rising | ADL rising | Positive pressure broadly confirms the advance |
| Price rising | ADL flat or falling | The advance lacks ADL confirmation |
| Price falling | ADL falling | Negative pressure broadly confirms the decline |
| Price falling | ADL flat or rising | The decline lacks ADL confirmation |
| Price sideways | ADL rising | Positive pressure may be developing inside the range |
| Price sideways | ADL falling | Negative pressure may be developing inside the range |
A lack of ADL confirmation is not a reversal signal. It simply means price has one less supporting condition.
ADL Divergence
ADL divergence occurs when price and the indicator form conflicting swing structures.
Divergence is one of the most common ADL use cases, but it is also one of the easiest to misuse. It should be treated as a warning, not as an automatic reversal signal.
Bullish ADL Divergence
Bullish divergence forms when price makes a lower low while ADL forms a higher low or trends upward.
This suggests that the new price low is not being confirmed by the same level of negative pressure shown by the indicator. It may be more relevant near established support or after an extended decline.
Bearish ADL Divergence
Bearish divergence forms when price makes a higher high while ADL forms a lower high or trends downward.
This suggests that positive pressure is not keeping pace with the price advance. It may be more relevant near resistance or after a sustained rally.
How to Evaluate ADL Divergence
The quality of the pivots matters.
A cleaner divergence compares swing highs or swing lows of similar importance. Avoid connecting a major price swing to a minor indicator wiggle just because the lines move in different directions.
As a practical rule, compare pivots that respect a similar 3–5 candle structure on both price and ADL. The exact number is not fixed, but it helps prevent forced divergence.
Higher-quality divergence usually includes:
- Clearly defined price pivots.
- Clearly defined ADL pivots.
- A meaningful support or resistance area.
- Several candles of disagreement.
- A subsequent price-action trigger.
- A clear invalidation level.
Lower-quality divergence usually comes from unrelated pivots, one- or two-candle disagreements, strong trends with no structure break, or signals that depend on one abnormal volume candle.
Confirmation usually comes from price reclaiming or losing structure after the divergence forms, such as a break of the most recent lower high in a bullish setup or a break of the most recent higher low in a bearish setup.
Advanced traders can make divergence more objective by measuring ADL slope over the same 5–10 bars used for the price swing. This does not make divergence predictive, but it can help reduce purely visual interpretation.
Divergence can persist for several new highs or lows before price turns. Some divergences never lead to a meaningful reversal.
ADL in Breakouts, Breakdowns, and Trading Ranges
ADL can help traders evaluate whether volume-weighted pressure supports a move through a major price level.
It is especially useful in ranges because price may stay sideways while the indicator begins to show directional pressure underneath the surface.
| Context | What to look for in ADL | What still confirms |
| Bullish breakout | ADL rising in the range, forming higher lows, or breaking its own swing high | Price closes above resistance and holds |
| Bearish breakdown | ADL falling in the range, forming lower highs, or breaking its own swing low | Price closes below support and holds |
| Range pressure | ADL trends while price remains sideways | Price eventually resolves in the same direction |
Imagine BTC trades sideways beneath resistance for several days. Price repeatedly returns to the middle of the range, but ADL forms higher lows and eventually moves above its own recent high. If price closes above resistance and ADL holds its breakout structure, the setup has one more supportive condition. If price falls back inside the range and ADL loses structure, the setup weakens.
Crypto-Specific ADL Considerations
ADL depends on volume data, and crypto volume is fragmented across spot exchanges, perpetual contracts, futures markets, and decentralized pools. Because ADL uses the OHLCV data from the selected chart, the same asset can produce different ADL structures across venues and instruments.
That makes volume source especially important in crypto. A thin altcoin pair may produce one large high-volume candle that pushes ADL sharply higher. The calculation may be valid for that chart, but if more liquid venues do not show similar participation, the move may not reflect broader market behavior.
For more consistent analysis, traders should:
- Use the venue and instrument most relevant to the trade.
- Avoid assuming spot and perpetual-futures ADL will match.
- Prefer liquid pairs with stable volume reporting.
- Be cautious when one thin market creates an oversized ADL move.
- Compare ADL structure, not raw values.
- Recheck the symbol and data source when the line behaves unusually.
This is one reason aggregate volume indicators can be valuable for crypto traders. Instead of relying only on a single exchange or isolated chart, aggregate volume analysis helps put ADL and other volume-based signals into broader market context.
Practical ADL Strategy Frameworks
These frameworks show where ADL can add context. They should be tested on the asset, timeframe, and data source being used.
| Setup | Market Context | What ADL Adds | Confirmation | Main Failure |
| Trend-continuation pullback | Price is trending and pulls back into support or resistance | Shows whether pressure holds during the pullback | Price resumes trend structure while ADL turns with it | A prior volume spike keeps ADL elevated even as price weakens |
| Range-breakout validation | Price consolidates between defined support and resistance | Shows whether pressure builds before price leaves the range | Price closes outside the range and ADL holds structure | Volume-source mismatch; see crypto data section |
| Divergence reversal | Price extends into support or resistance after a strong move | Shows disagreement at a new price extreme | Price breaks the existing trend structure | Divergence appears too early and price continues trending |
| Multi-timeframe alignment | Higher timeframe defines bias, lower timeframe defines execution | Checks whether participation supports the broader read | Lower timeframe resumes in the higher-timeframe direction | Mixing spot, perp, or exchange data creates inconsistent signals |
ADL confirmation can improve the quality of a setup, but it should not determine position size by itself. Risk should come from a tested framework that defines entry, invalidation, exposure, and review criteria before the trade is taken.
Combining ADL with Other Tools
ADL pairs best with tools that answer different questions.
Price structure can define where the setup matters. Relative volume can show whether current activity is unusually high or low. VWAP or moving averages can provide trend context. Volume Profile can show where trading activity has concentrated by price level.
ADL then acts as a participation check.
Avoid stacking ADL with closely related Chaikin tools and treating the result as independent confirmation. ADL, Chaikin Money Flow, and the Chaikin Oscillator share similar logic.
ADL vs. Similar Volume Indicators
ADL is often compared with OBV, Chaikin Money Flow, and the Chaikin Oscillator. The differences matter because each tool treats volume differently.
| Indicator | Core calculation | Output | Best suited to | Main limitation |
| ADL | Close location within current range × volume, cumulatively added | Unbounded cumulative line | Trend confirmation, ranges, divergence | Ignores close-to-close changes |
| OBV | Adds or subtracts full volume based on current close versus previous close | Unbounded cumulative line | Simple volume-trend confirmation | Ignores where price closes within the current range |
| CMF | Rolling Money Flow Volume divided by rolling total volume | Bounded around -1 to +1 | Current pressure over a chosen window | Sensitive to lookback length |
| Chaikin Oscillator | Fast EMA of ADL minus slow EMA of ADL | Oscillator around zero | Changes in ADL momentum | Adds smoothing parameters and lag |
The main distinction is that OBV uses close-to-close direction, while ADL uses the close’s location inside the current candle range. That is why OBV and ADL can move in opposite directions on the same chart.
ADL Limitations, Mistakes, and Best Practices
| Limitation | Common mistake | Best practice |
| ADL is not true order flow | Treating it as actual net buying or selling | Use it as a pressure proxy |
| ADL ignores the previous close | Missing gaps, discontinuities, or close-to-close weakness | Compare ADL with price structure |
| ADL is cumulative | Comparing raw values across assets or exchanges | Compare slope, swings, and structure |
| ADL depends on volume source | Trusting thin or irrelevant venue signals | Use the chart that matches the market being evaluated |
| One candle can distort the line | Treating a spike as lasting confirmation | Inspect the candle and look for follow-through |
| Divergence is subjective | Forcing unrelated pivots | Use corresponding swing points |
| No universal thresholds exist | Using zero as a bullish or bearish trigger | Focus on recent structure |
A practical ADL workflow can stay simple:
- Define price structure first.
- Compare ADL against the same swings.
- Watch for confirmation, divergence, or range pressure.
- Use price structure for invalidation.
Accumulation / Distribution Line: Final Thoughts
The Accumulation Distribution Line gives traders a structured way to study how volume interacts with each candle’s closing position. Its greatest value lies in the relationship between price and the line: confirmation, divergence, range pressure, and breakout support.
A clean way to practice is to add ADL to one liquid BTC or ETH chart, mark the key swings, and compare whether the line confirms, diverges, or stays neutral. Record what happened after each condition instead of assuming the first read was correct.
Used well, ADL is a participation check. It helps traders ask a better question before trusting a move: Is price moving with volume-weighted support, or is the chart telling a weaker story beneath the surface?